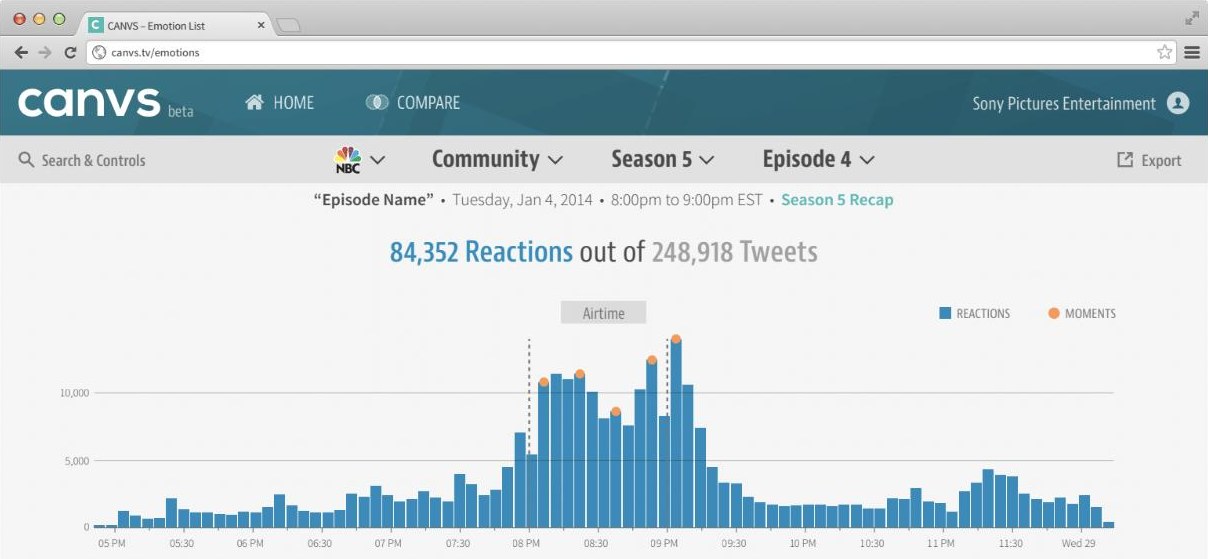
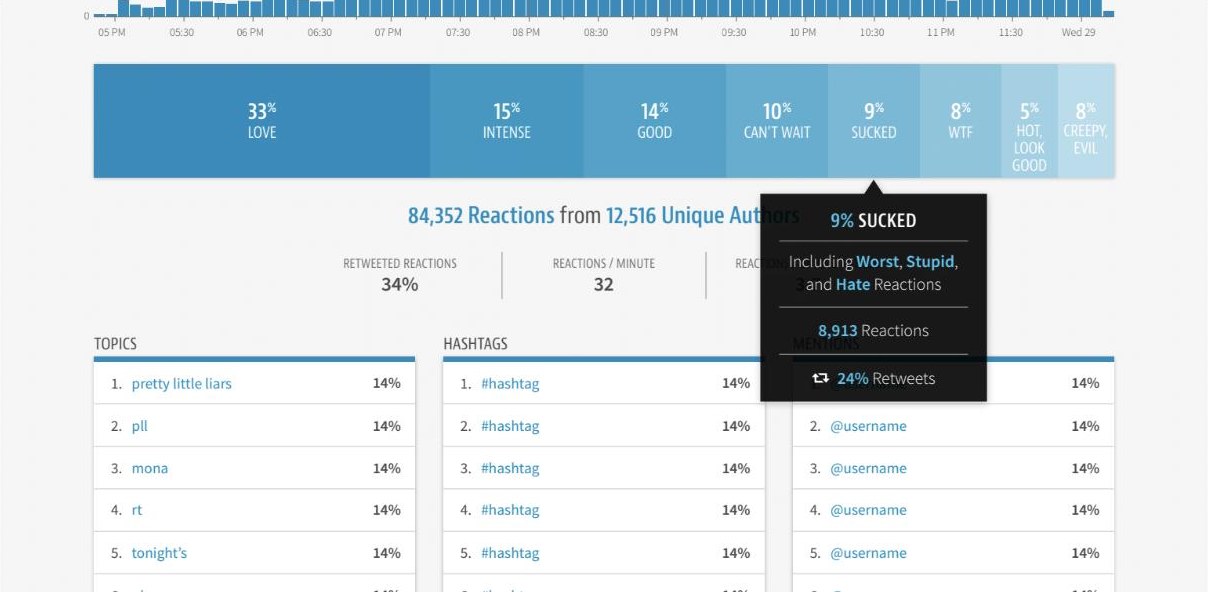
Canvs measures how audiences feel about TV by reading their tweets. The reactions view charts an episode’s reactions across its airtime (a spike of “moments” through the broadcast hour), breaks them down by emotion (love, intense, good, can’t wait, sucked, WTF…), and surfaces the topics, hashtags, mentions and most-retweeted tweets driving them.
Behind the reaction bars, the data had to be sliced by network, series, season, genre and time slot (morning, daytime, primetime, late night), so I added a field-selection option to the API that made topic queries across large sets, such as a whole network, return faster.